Victoria Morais' Portfolio

Technical assistance location

How we improved the service and made the searching process for technical assistance more efficient

Visual concept

Overview

I was responsible for the product discovery process and when it had been concluded, the team chose the next squad's mission: to improve the location service of the technical assistants. This service shows the closest assistance in the user's region. It helps users when they have a problem with their home appliance and need to repair it.

Project information

  • Estimated time: 4 months
  • My role: Product Designer
  • KPI goal: +5% of the online schedule

Discovery

Before beginning the mission, I needed to understand and collect all the information about the service. The CSD matrix was the perfect tool to discover our certainties, suppositions and doubts about this service and direct the research and improvements.

After a critical analysis of the information, some questions were raised. It had been discovered during the project and in the end, we had to get the answers to it.

CSD matrix

CSD matrix
CSD matrix participants: Product Designers, CRO, PO, SEO, Developers, QA, Tech Lead and Stakeholders.

Suppositions

  • "Users don't know which services a technical visit attends"
  • "Users may schedule a visit to solve the problem using an online service"
  • "Users are searching for more information about the tecnhical assistant on this page"

Questions and uncertainties

  1. At which moment do users start using it (scenario)?
  2. What do they need for this service?
  3. What's the preferred channel for looking for information?

Analytics

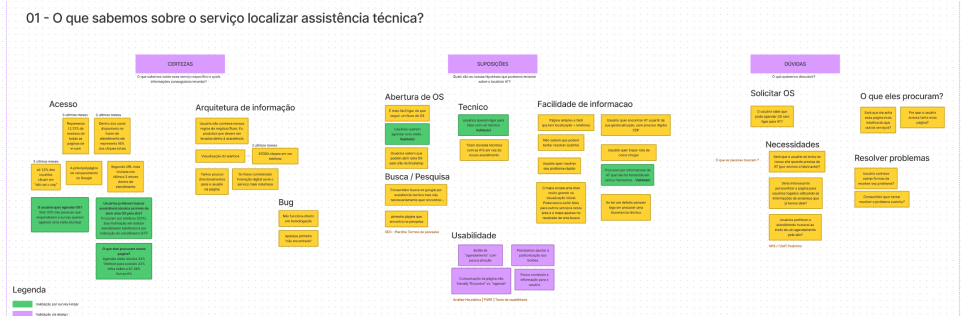
At that moment, I searched for the information based on the CSD matrix to validate all the certainties presented. The challenge was to sort through the data and make meaningful information about the suppositions and doubts to do the survey.

Metrics

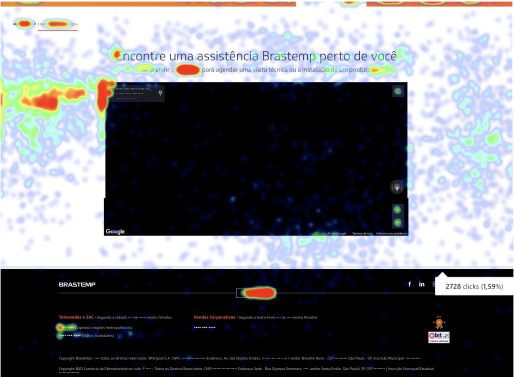
  • +60% of organic access
  • 3rd page with more visits per month
  • 16% of all online services representation

Hotjar surveys and clarity heatmaps

I used heatmaps to understand the users' interaction on the site and their engagement and identified areas of opportunity in the web page.

The survey was made to discover the principal questions about the user's interaction with the page.

Clarity heatmap
The Clarity heatmap.

What's the channel preference for looking for information?

  • 58%
  • prefer chat or WhatsApp
  • 45-54
  • year olds use WhatsApp
  • 55+
  • only use the telephone

What do they need for this service?

  • 28%
  • information about the service
  • 33%
  • want to schedule a visit
  • 32%
  • speak to a technician by phone

Benchmark: how is the competition?

At this stage, I focused on analyzing four strategic topics:

  1. Access (which ways do their users access the service?)
  2. The service's features (what users can do in the service?)
  3. Usability
  4. Security (how much difficulty is it to use the service?)
Benchmarking analysis
Benchmarking analysis.

Validation and ideation

Heuristic analysis

To bring better improvements to the page, I conducted an heuristic analysis to get insights and opportunities for improvements.

Heuristic pillars

Findability

Organization and prioritization of the information.

Accessibility

This service page is not accessible at all.

Desirability

Is this service useful and helpful for user needs?

Usability

Bugs and absence of returning error messages.

Storytelling

Does it explain or share thoughts on what users can do?

Heuristic data

Analysis reflection
Heuristic analysis
Heuristic analysis. Participants: Product Designers.
Analysis comparison
Heuristic comparison with other service pages. Participants: Product Designers.

Brainstorm

I discovered that users access our service page because they are looking to schedule a visit to repair their home appliance. This was the opportunity we were looking for!

The next stage was to find solutions with the team. How can we explore this scenario and improve a better way to do it?

Brainstorm
Brainstorming session. Participants: Product Designers, Developers, Product Owner, CRO and Tech Lead.

Prioritization matrix

After the brainstorming, we got a lot of ideas, and we needed to filter and choose which one should be the best choice. The prioritization matrix assisted us in prioritizing ideas based on technology and business value (the user needs we addressed from the start), and we invested in ideas with low technological effort and high business value.

Solutions from brainstorming

  1. Offer the types of service on the page (installation, conversion and repair)
  2. Map improvements (color contrast and information)
Prioritization matrix
Prioritizing the improvements. Participants: Product Designers, Product Owner and Tech Lead.

Ideation

At this stage, we already had a page of the service. We made incremental improvements and added the solutions in a strategic way. The challenge at this moment was to deliver an assertive solution without making a lot of changes.

1. Offer the types of service on the page (installation, conversion and repair)

Origin page
New page

A comparison of the two pages before incremental improvements: on the left is the origin page and on the right is the new page.

2. Map improvements (color contrast and information)

Origin page
New page

A comparison of the two pages before incremental improvements: on the left is the origin page and on the right is the new page.

Results and learnings

In this project, I had the opportunity to use design methods of learning about our users. The biggest challenge was to adapt the process to our deadline and the user's low engagement made it difficult to interview for more details of the user's needs. Perhaps it's because at the moment of the user journey, they come to us already with a problem and then try to use our services to solve it, making our contact more difficult to make (they just want their problem to be solved!).

Highlights

  • +25%of users scheduling their visit online!
  • Strategic goal achieved! 🎉 🎉
  • -11% on telephone calls!